Visualization on traffic-related problems within selected municipalities (a django web app)
Information from users of the road revealed high incidents of traffic-related problems. The municipalities have a need to understand what these problems are, where they are located, and areas with the most problems et cetera. The purpose of this was to serve as input into their policy making decisions.
To this end, I created a visualization tool with Django, HTML, CSS, and JavaScript which does the following:-
- Identify locations with traffic-related problems and the kinds of problems.
- Calculates the areas with high density of traffic related problems ( hot/cold spot spatial analysis).
- Highlights patterns across the different municipalities.
NOTE:- Remaining information to be added

Main components of the web app
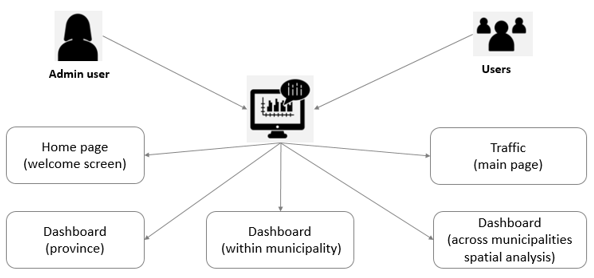
The tool comprises the following:
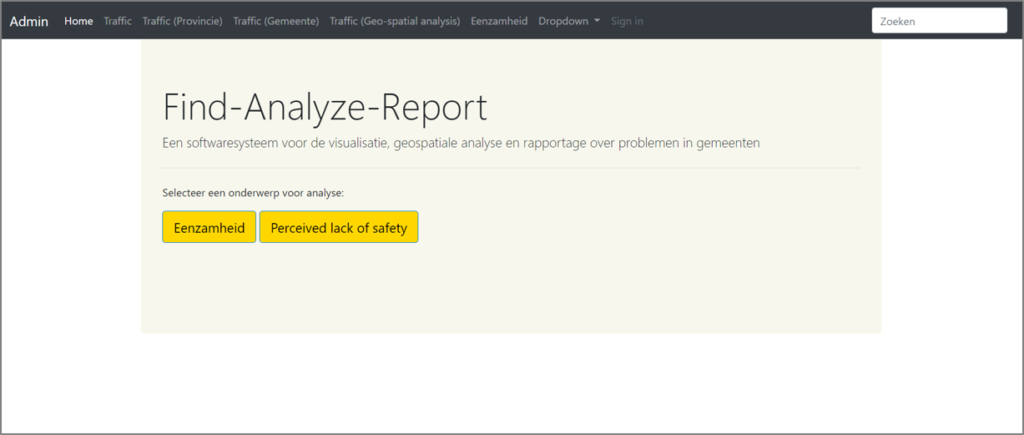
- Home page: The landing page for the selection of the analysis of interest, i.e., traffic-related problems or public health concern.
- Traffic page: A page for the upload of the data file and refreshing of the built-in machine learning model.
- Dashboard #1 – Province: A dashboard for the aggregated view of traffic-related problems across all provinces.
- Dashboard #2 – Municipality: A dashboard for the visualization of problems within municipalities.
- Dashboard #3 – Spatial analysis: A dashboard for the visualization and output of reports on spatial analyses calculations.

