SFO Crime Analytics
The San Francisco police department takes note of crime incidents within their jurisdiction in terms of the date the crime occurred, the type of crime, and resolution et cetera. Other functions include having an oversight of crime per region in order to know how to allocate resources. This project seeks to provide insights into findings in the crime. These include:
- Insights and visualization on crime across the districts.
- Identification of kinds of problems in the districts (statistical analysis).
- Identification of hot/cold spots.
Problem Statement, Data & Approach
Data: Data sources for this project include crime incidents reported within the San Francisco (SFO) area, location of police stations, and SFO shape files. The crime data comprised 150 000 incidents.
Entity Relationship: The crime data was merged with the shape files along districts.
Data Preparation: Check for missing values and duplicates et cetera. Duplicated incident numbers with differing categories of crime were treated as one incident report.
Approach: This includes categorizing the kinds of crime incidents into 8 via text analysis, calculating summary statistics on the number and kinds of crime per district, and conducting spatial analysis (hot/cold spot) analysis across the districts. Algorithms used include but not limited to k-means clustering, DBSCAN et cetera.
Crime Labels: A total of 8 labels were created on the category of crime reported, namely:
- Theft: Comprising theft, larceny, vehicle theft, robbery, property theft etc
- Assault – Vandalism: Comprising assault, vandalism etc
- Missing_Suicide: missing person, kidnapping, suicide etc
- Fraud: comprising fraud, embezzlement, forgery
- Narcotics_Drunk_Sex: comprising sex offences, prostitution, pornography, drinking under influence, drunkenness etc
- Gambling_Warrants_Other: gambling etc
- Noncriminal: recovered vehicle, non-criminal offences etc
- Unknown:
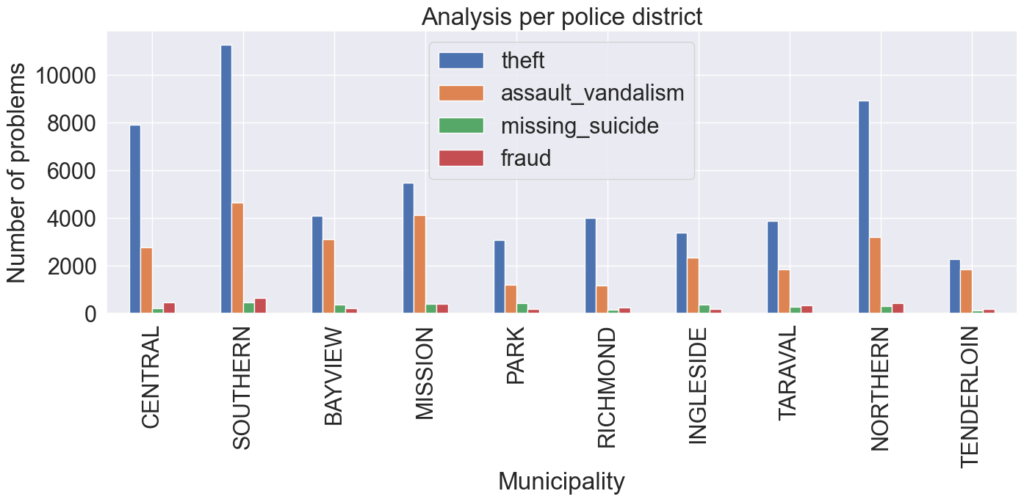
Statistical Analysis: The total number of crime incidents and kinds of crime were calculated per district.
Geo-Spatial Analysis: To be completed
- Hot/cold spot analysis
NOTE: Work is in progress on this dataset and will be updated in due course.
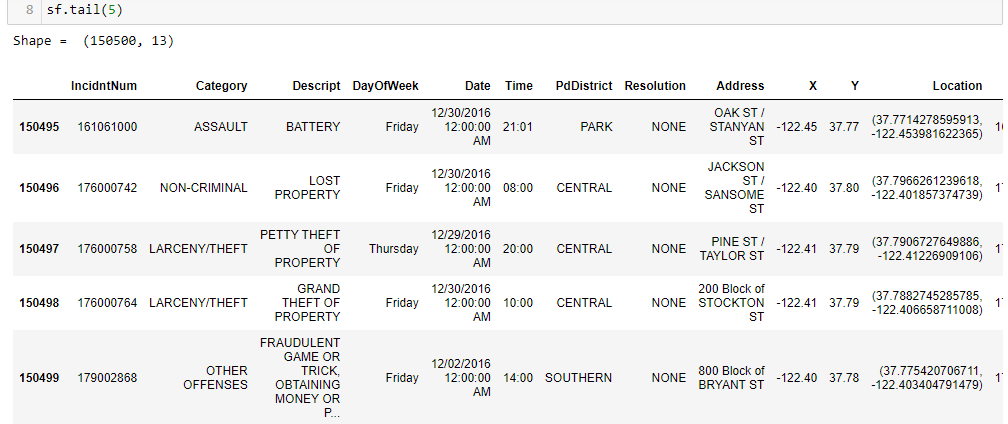
Shape: 150500 rows x 13 columns
0 IncidntNum
1 Category
2 Descript
3 DayOfWeek
4 Date
5 Time
6 PdDistrict
7 Resolution
8 Address
9 X
10 Y
11 Location
12 PdId

Insights

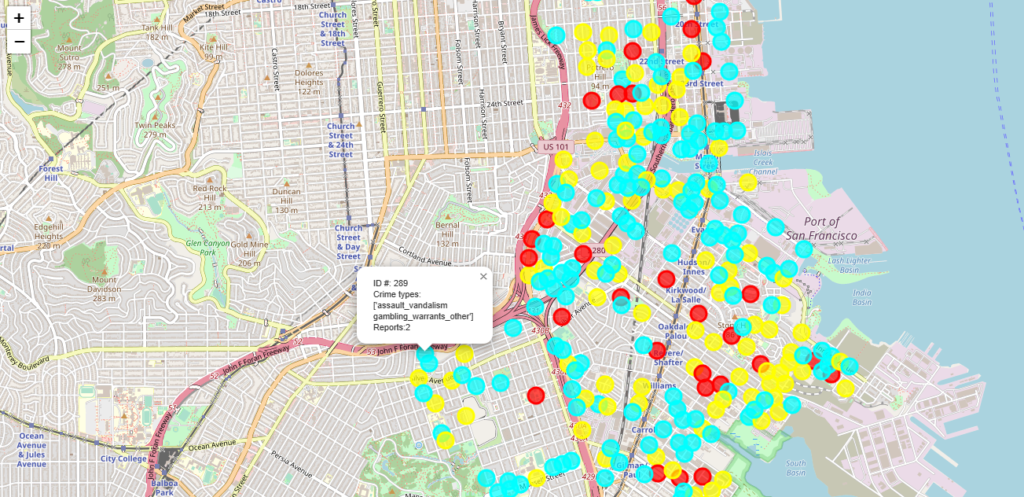
The color coding on the map signifies:
- red: for areas with up to ten (10) incidents;
- yellow: for areas between ten (10) and fifty (50) incidents; and
- cyan: for areas with above fifty (50) incidents.


We observe crime related to theft, assault/vandalism, missing persons / suicide,
and gambling/warrants seem to rise from the West to East of San Francisco. On the other hand, crime related to fraud and unknown-crime type seem to increase from the East to West.
Concentrated on the outskirts is narcotics and non-criminal incidents.

Crime Hot / Cold Spots
To be completed
